Comparative Traffic Overview of Previous Projects
Here are 6 example projects along with their traffic comparison.
Project 1
Project 2
Project 3
Project 4
Project 5
Project 6
Project 1 : Techrestore
Explanation of the Traffic Comparison (Google Search Console Performance Report)
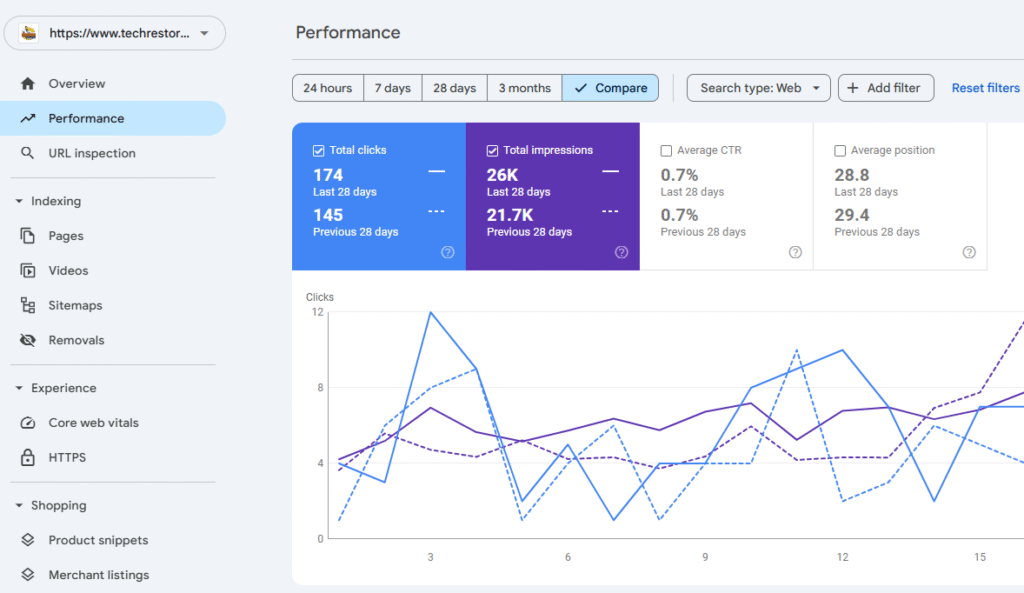
The image shows a Google Search Console “Performance” report for the website https://www.techrestore.com/. This report helps website owners understand how their site performs in Google Search results.
Let’s break down the key metrics and the comparison:
-
Time Period: The comparison is set for “28 days” versus “Previous 28 days.” This means it’s comparing the most recent 28-day period to the 28 days immediately preceding it.
-
Key Metrics Displayed:
-
Total Clicks:
-
Last 28 days: 174 clicks
-
Previous 28 days: 145 clicks
-
Comparison: This is a positive trend, showing an increase in clicks (174 vs. 145). The exact percentage increase would be (174-145)/145 * 100 = 20%.
-
-
Total Impressions:
-
Last 28 days: 26K (26,000) impressions
-
Previous 28 days: 21.7K (21,700) impressions
-
Comparison: Also a positive trend, indicating the website is appearing more often in search results (26,000 vs. 21,700). The exact percentage increase would be (26000-21700)/21700 * 100 = 19.8%.
-
-
Average Position:
-
Last 28 days: 28.8
-
Previous 28 days: 29.4
-
Comparison: This is a positive change. A lower average position is better. Going from 29.4 to 28.8 indicates a slight improvement in the website’s ranking in search results. An average position of 28.8 means that, on average, the website appears on roughly the 3rd page of Google search results (since there are usually 10 results per page).
-
-
Overall Traffic Summary: The website techrestore.com has seen positive growth in terms of visibility (impressions) and actual visitors from Google Search (clicks) over the last 28 days compared to the previous 28 days. The average position has slightly improved, and the click-through rate has remained consistent. This suggests that the website’s SEO efforts (if any) are having a positive impact, or there’s increased search interest in their topics.
Project 2 : Labcell
Explanation of the Traffic Comparison (Google Search Console Performance Report)
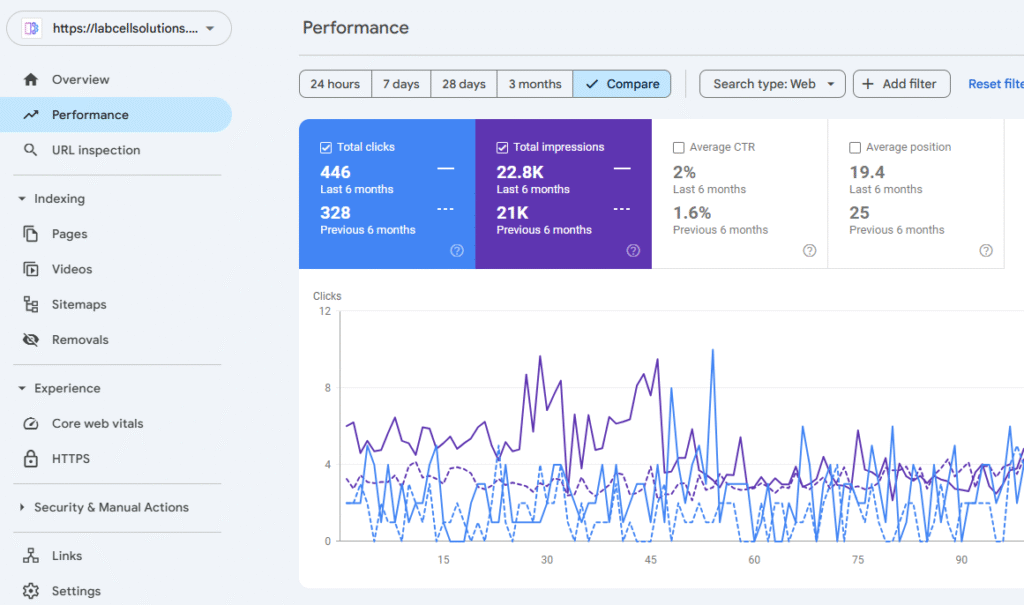
The image displays a Google Search Console “Performance” report for https://labcellsolutions.com/, comparing key metrics over two 6-month periods. This report provides insights into how the website is performing in Google Search results.
Let’s break down the metrics and the comparison:
-
Time Period: The comparison is set for “6 months” versus “Previous 6 months.” This means the data for the most recent six months is being compared to the six months immediately prior.
-
Key Metrics Displayed:
-
Total Clicks:
-
Last 6 months: 446 clicks
-
Previous 6 months: 328 clicks
-
Comparison: This indicates a positive trend with a significant increase in clicks (446 vs. 328). This is approximately a 36% increase in clicks.
-
-
Total Impressions:
-
Last 6 months: 22.8K (22,800) impressions
-
Previous 6 months: 21K (21,000) impressions
-
Comparison: A positive trend, showing a slight increase in how often the website appeared in search results (22,800 vs. 21,000). This is roughly an 8.6% increase in impressions.
-
-
Overall Traffic Summary: labcellsolutions.com has demonstrated strong positive growth in its organic search performance over the last six months. It has significantly increased its clicks, seen a healthy rise in impressions, improved its click-through rate, and achieved a better average search ranking. This indicates successful SEO efforts or increasing relevance in its niche.
Project 3 : Mobile Clinic
Explanation of the Traffic Comparison (Google Search Console Performance Report)
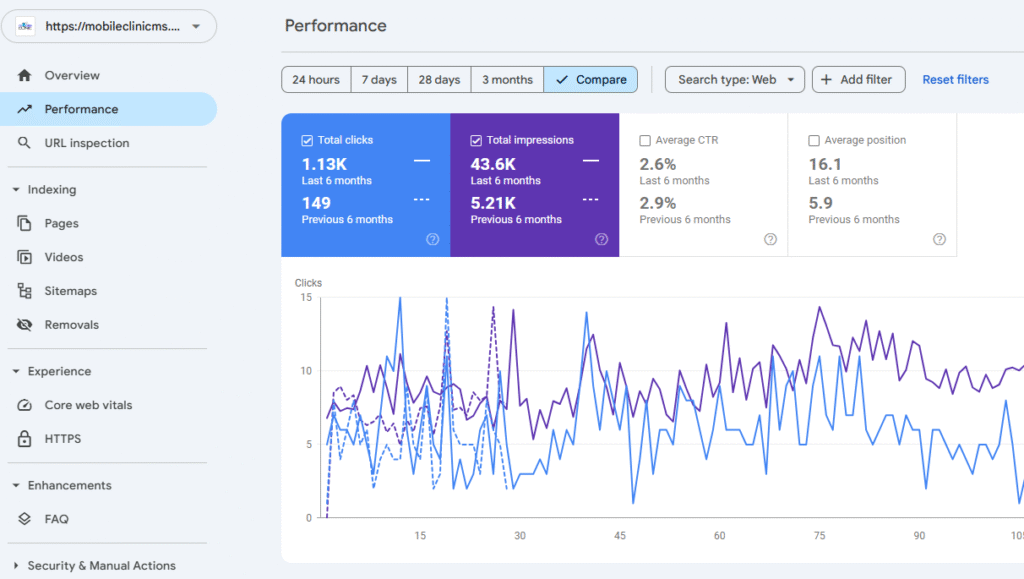
The image shows a Google Search Console “Performance” report for https://mobileclinicms.com/, comparing its performance in Google Search results over two 6-month periods.
Let’s break down the key metrics and their comparison:
-
Time Period: The comparison is set for “6 months” versus “Previous 6 months.” This means the data for the most recent six months is being compared to the six months immediately preceding it.
-
Key Metrics Displayed:
-
Total Clicks:
-
Last 6 months: 1.13K (1,130) clicks
-
Previous 6 months: 149 clicks
-
Comparison: This is an enormous positive increase. The site went from 149 clicks to 1,130 clicks, which is an increase of approximately 658%. This indicates a very significant growth in organic search traffic.
-
-
Total Impressions:
-
Last 6 months: 43.6K (43,600) impressions
-
Previous 6 months: 5.21K (5,210) impressions
-
Comparison: Also a massive positive increase, reflecting the clicks. The site gained significantly more visibility in search results, from 5,210 impressions to 43,600, an increase of about 737%.
-
-
Overall Traffic Summary: https://mobileclinicms.com/ has experienced explosive growth in terms of overall organic search visibility (impressions) and traffic (clicks) over the last six months. However, this growth has come with a trade-off: a decrease in average ranking position and a slight decline in click-through rate. This suggests that while the website is appearing for many more searches, it’s not always appearing in the most prominent positions, and some of the new impressions might not be as targeted. The challenge now is to maintain or increase traffic while improving the quality of impressions and rankings.
Project 4 : Smart Phone Locust
Explanation of the Traffic Comparison (Google Search Console Performance Report)
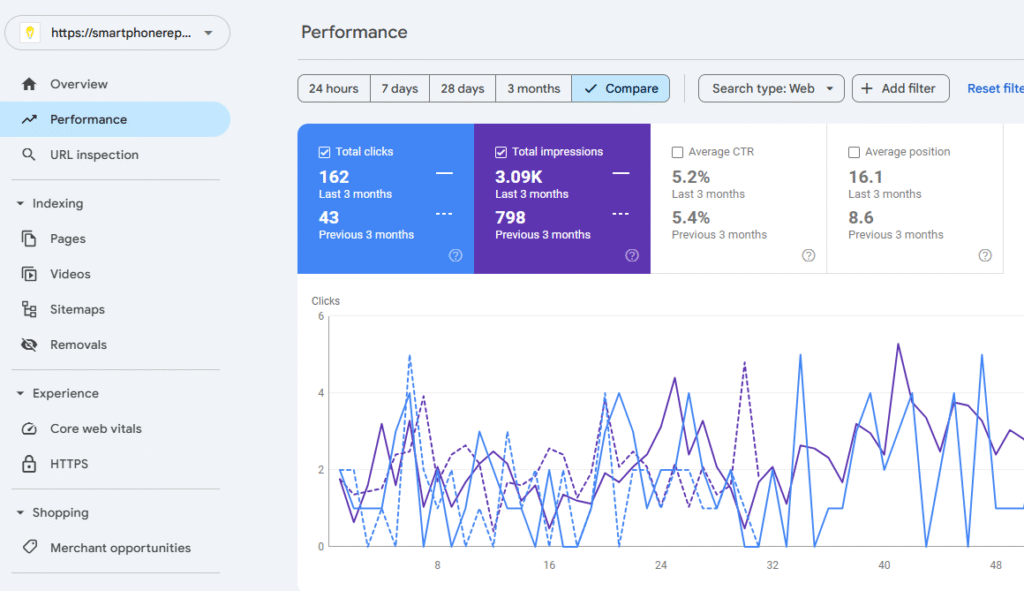
The image displays a Google Search Console “Performance” report for a website, comparing its performance in Google Search results over two 3-month periods. Based on the URL in the screenshot and filename, it appears to be related to “smartphone repair” in a location like “Locust.”
Let’s break down the key metrics and their comparison:
-
Time Period: The comparison is set for “3 months” versus “Previous 3 months.” This means the data for the most recent three months is being compared to the three months immediately preceding it.
-
Key Metrics Displayed:
-
Total Clicks:
-
Last 3 months: 162 clicks
-
Previous 3 months: 43 clicks
-
Comparison: This shows a very significant positive increase in clicks. The site went from 43 clicks to 162 clicks, which is an increase of approximately 277%. This indicates a substantial growth in organic search traffic.
-
-
Total Impressions:
-
Last 3 months: 3.09K (3,090) impressions
-
Previous 3 months: 798 impressions
-
Comparison: Also a very strong positive increase in visibility. The site gained significantly more impressions, from 798 to 3,090, an increase of about 287%.
-
-
Overall Traffic Summary: The website has experienced remarkable growth in organic search visibility (impressions) and direct traffic (clicks) over the last three months. However, this growth has come at the cost of a lower average search position and a minor decline in click-through rate. This suggests that the site is now visible for a much wider range of search queries, but it needs to work on improving its ranking for the most valuable terms and converting those impressions into clicks more effectively.
Project 5 : Galaxy Cabinets
Explanation of the Traffic Comparison (Google Search Console Performance Report)
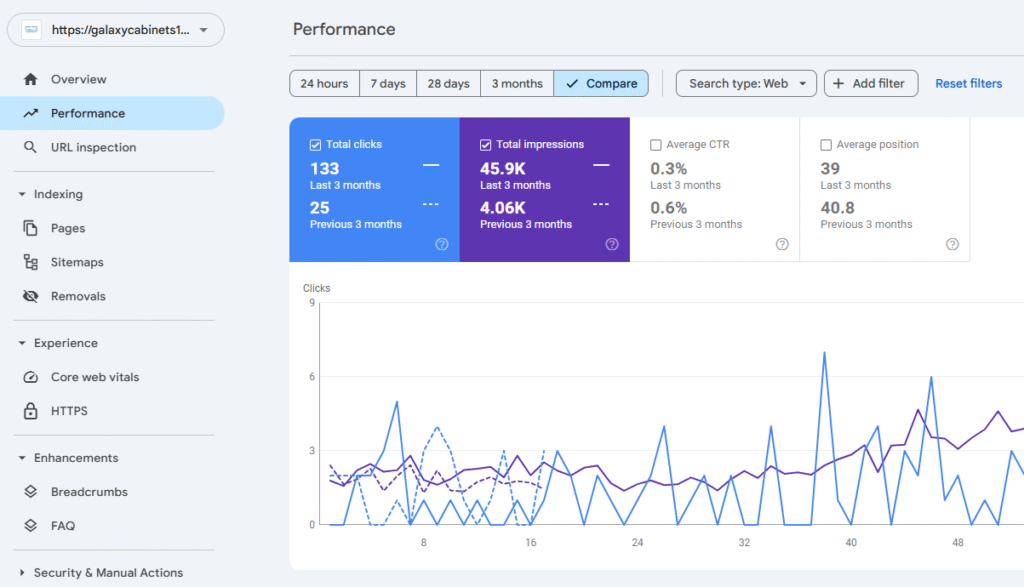
The image displays a Google Search Console “Performance” report for a website Galaxycabinets17.com, comparing its performance in Google Search results over two 3-month periods. The domain in the screenshot suggests it’s related to “galaxy cabinets.”
Let’s break down the key metrics and their comparison:
-
Time Period: The comparison is set for “3 months” versus “Previous 3 months.” This means the data for the most recent three months is being compared to the three months immediately preceding it.
-
Key Metrics Displayed:
-
Total Clicks:
-
Last 3 months: 133 clicks
-
Previous 3 months: 25 clicks
-
Comparison: This is an outstanding positive increase. The site went from 25 clicks to 133 clicks, representing an increase of approximately 432%. This indicates a very significant surge in organic search traffic.
-
-
Total Impressions:
-
Last 3 months: 45.9K (45,900) impressions
-
Previous 3 months: 4.06K (4,060) impressions
-
Comparison: Also an enormous positive increase in visibility. The site gained dramatically more impressions, from 4,060 to 45,900, an increase of about 1030% (over 10 times more visible)
-
-
Overall Traffic Summary: The website https://galaxycabinets17.com has experienced phenomenal growth in terms of organic search visibility (impressions) and direct traffic (clicks) over the last three months. However, this has come with a halving of its click-through rate (CTR), even with a slight improvement in average position. This indicates that while the site is now appearing for a vast number of searches, it’s often appearing in less prominent positions (average 4th page) and its search snippets aren’t as effective at compelling clicks for those new, broader impressions.
Project 6 : Saray Turkish Restaurant
Explanation of the Traffic Comparison (Google Search Console Performance Report)
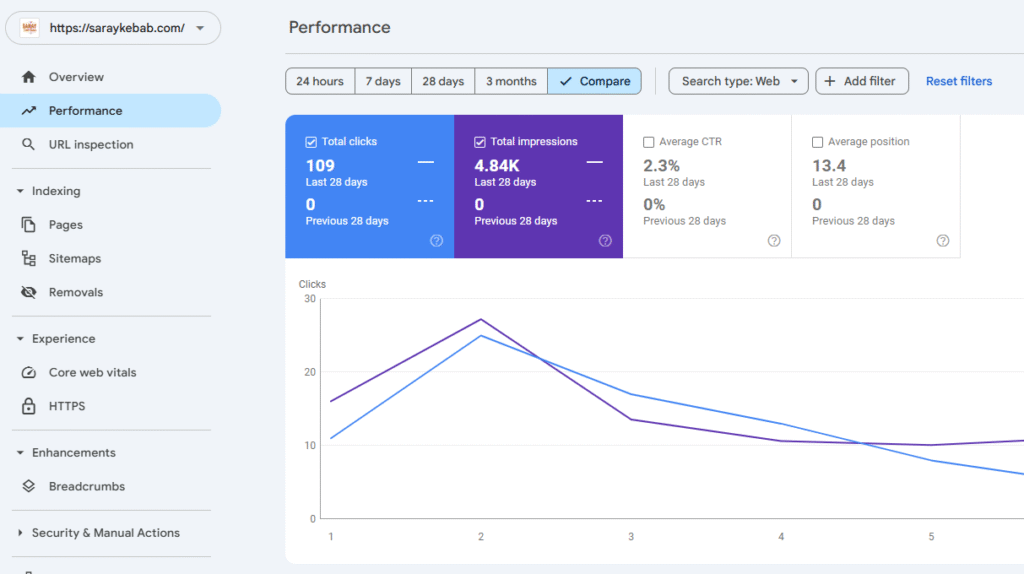
The image displays a Google Search Console “Performance” report for https://saraykebab.com/, comparing its performance in Google Search results over two 28-day periods. This website likely belongs to a restaurant, possibly specializing in Turkish kebabs.
Let’s break down the key metrics and their comparison:
-
Time Period: The comparison is set for “28 days” versus “Previous 28 days.” This means the data for the most recent 28-day period is being compared to the 28 days immediately preceding it.
-
Key Metrics Displayed:
-
Total Clicks:
-
Last 28 days: 109 clicks
-
Previous 28 days: 0 clicks
-
Comparison: This is an extremely significant positive change. Going from 0 clicks to 109 clicks means the website has essentially started gaining organic search traffic within the last month. This indicates a new website, a newly indexed website, or a website that has recently seen a significant SEO improvement or a surge in local search interest.
-
-
Total Impressions:
-
Last 28 days: 4.84K (4,840) impressions
-
Previous 28 days: 0 impressions
-
Comparison: Similar to clicks, this is a massive positive increase in visibility. The site appeared in search results 4,840 times in the last 28 days compared to zero in the previous period. This confirms the notion of the site recently gaining traction in Google Search.
-
-
Overall Traffic Summary: https://saraykebab.com/ has essentially launched its presence in Google Search within the last 28 days. It has gone from virtually no organic search visibility to generating over 100 clicks and thousands of impressions, with a respectable average position for a new player. The initial spike and subsequent leveling suggest early indexing and discovery, which now needs to be nurtured into consistent growth.